You are using an out of date browser. It may not display this or other websites correctly.
You should upgrade or use an alternative browser.
You should upgrade or use an alternative browser.
The Wiz of Odds: ESPN's 'Game Day' Problem
- Thread starter HTO
- Start date
dtbugeater
New member
Man, I have heard enough about the SEC to last me a life time. Part of me hopes the south just falls into the ocean--
But... this graph isn't a real problem for me. The SEC currently has the most interesting stuff to talk about. They had more interesting matchups (that may or may not be changing in the weeks ahead) and more schools in the top 5. If the Big 10 had 4 teams in the top 5, I bet that graph would be heavy big 10.
I know it is fun to say that ESPN hates on Nebraska, but back in the 90's when we were kicking a$$ and had a national following, they made it a point to talk about Nebraska on every college football show. Even when Nebraska didn't have anything particularly interesting happening. Now it is the SEC's turn. In 5 years I suspect it will be the PAC12 but who knows...
zoogs
New member
On the one hand, the SEC does have a lot of the top teams, as determined at least in part by ... perception.
ESPN has a vested financial interest in perpetuating this situation. Seems clear that this is a problem, although mainly it owes to ESPN's stature. Allowing the most successful companies to drive and fuel continued financial success harms the overall product of college football. I imagine SEC fans would say it's just fair game.
I'm curious how the other networks and conferences intend to combat this.
Last edited by a moderator:

VA Husker Fan
New member
That's pretty bad. I actually haven't been watching GameDay much this year.
NUpolo8
Banned
I for one am stunned they spend the most time talking about the highest ranked teams. It's a horror.
It's not limited to here either. Every swimsuit issue I've gotten from sports illustrated has really nice looking women on it with rockin chest beefers,they don't give any equal time to the 280 pound girls.
It's not limited to here either. Every swimsuit issue I've gotten from sports illustrated has really nice looking women on it with rockin chest beefers,they don't give any equal time to the 280 pound girls.
RedRedJarvisRedwine
New member
Keep Fightin the fight for the chubbers Polo!I for one am stunned they spend the most time talking about the highest ranked teams. It's a horror.
It's not limited to here either. Every swimsuit issue I've gotten from sports illustrated has really nice looking women on it with rockin chest beefers,they don't give any equal time to the 280 pound girls.
NUpolo8
Banned
They're like mopeds, kimosabe.Keep Fightin the fight for the chubbers Polo!I for one am stunned they spend the most time talking about the highest ranked teams. It's a horror.
It's not limited to here either. Every swimsuit issue I've gotten from sports illustrated has really nice looking women on it with rockin chest beefers,they don't give any equal time to the 280 pound girls.
Kernal
New member
Do Michigan fans really want to hear endlessly about the SEC teams? Probably not. Yet they still manage to put 100,000 people in their stadium for games. It's about the same everywhere. People want to hear about their teams, their conference, their matchups. For some reason, lots and lots of games take place every week that aren't in the SEC. Why do they even bother? This is the big reason I don't watch Gameday or ESPN anymore.
The only people who want to constantly hear about the SEC are fans of SEC teams, and investors in the SEC/ESPN network.
The only people who want to constantly hear about the SEC are fans of SEC teams, and investors in the SEC/ESPN network.
Kernal
New member
For those who haven't seen it, here's a pretty funny satire of Gameday's script for this weeks Michigan State-OSU game.
http://www.elevenwarriors.com/college-football/2014/10/42559/first-look-espn-college-gameday-in-east-lansing-ohio-state-michigan-state
http://www.elevenwarriors.com/college-football/2014/10/42559/first-look-espn-college-gameday-in-east-lansing-ohio-state-michigan-state
Florida State (ACC), winners of 20-some straight games, Oregon/Arizona State (PAC), KSU/TCU (B12), Notre Dame (Ind/ACC) and Michigan State (B1G) all disagree with your sarcastic but humorous response. There's 7 of the top 10 teams in the county, I fully expect ESecPN to slobber over each one this upcoming Saturday.I for one am stunned they spend the most time talking about the highest ranked teams. It's a horror.
After all, it's about "the highest ranked teams", right?!?
Last edited by a moderator:
zoogs
New member
Florida State didn't play on either of the two days portrayed in the graphs: a bye week one time and a Thursday game the next.
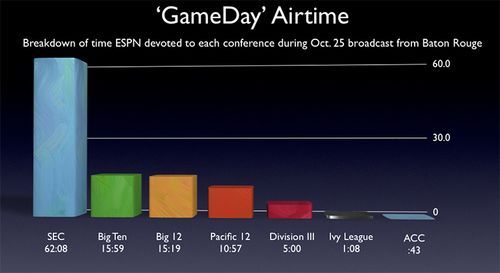
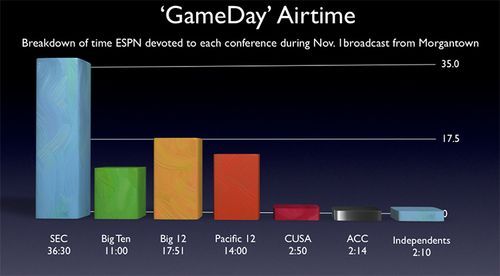
I hate to nitpick also, but one issue I have with the graphs is it does seem to take some visual liberties. According to the times given, the SEC bar in the first graph should be at 55.9%, not 60%. In the second graph, it would appear there are about 15 minutes of unincluded statistics (if the 35% and 17.5% portrayals are accurate). SEC coverage seems to decline from 55.9% in the first graph to 35% in the second, although it's unclear that this happens because the bars look the same height -- and because it's unclear where that decline went to. Indeed, from the provided times only, the first graph lists an extra 24 mintues, 39 seconds compared to the second.
All this notwithstanding, I'm in agreement that ESPN has a clear interest in the SEC and it's not hard to see why.
Last edited by a moderator:
JJ Husker
Donor
That is hilarious.For those who haven't seen it, here's a pretty funny satire of Gameday's script for this weeks Michigan State-OSU game.
http://www.elevenwarriors.com/college-football/2014/10/42559/first-look-espn-college-gameday-in-east-lansing-ohio-state-michigan-state
