Media Bias

The deficit is a byproduct of the insane amount of spending by all parties.  The tax cuts increased government revenue and if not for COVID record revenue would have continued into FY2021/2022
Neither of these platitudes provide justification for disagreeing with my statement above, nor do they provide compelling arguments against the supplemental evidence I provided for my above opinion.

Perhaps the two biggest guarantees from Trump and top Republicans regarding their tax cuts were:

- improving the deficit

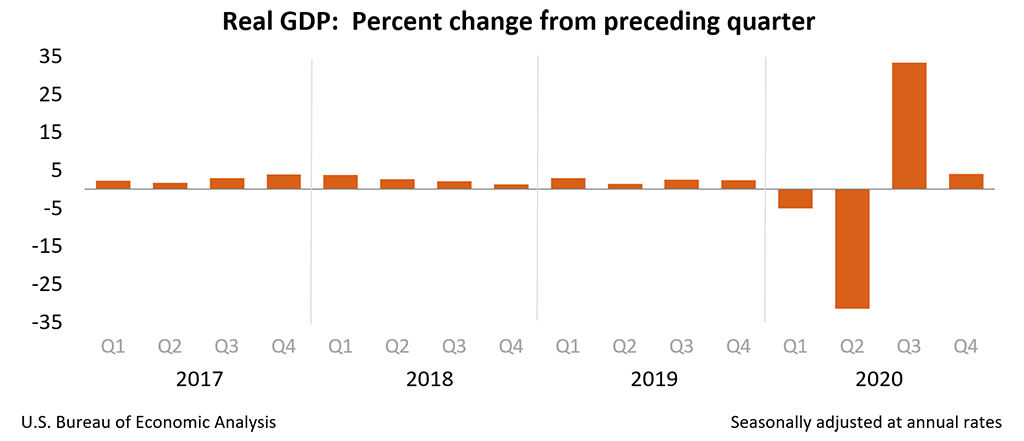
- usher in 3% GDP growth

Neither of those things happened. What did happen was increased revenue. Is increased revenue a success? Yes. Did that make their policy a success? No; at least, not based on the objectives they themselves outlined as what would constitute success. The policy failure was evident prior to COVID. If increased revenue was their only goal, then that'd be one thing. But, it wasn't. They pumped up several major goals they wanted to accomplish through their tax cuts and most of what they promised didn't happen. No real way to slice it otherwise.

 
Last edited by a moderator:
The deficit is a byproduct of the insane amount of spending by all parties.  The tax cuts increased government revenue and if not for COVID record revenue would have continued into FY2021/2022
That is a guess at best.

There is an argument to be made that revenues were not that affected by the pandemic.  Yes, a certain part of the economy was severely affected like restaurants, bars, entertainment...etc.  But, manufacturing and consumption over all didn't go down.  in fact, the demand for goods increased drastically during the last 12 months which would increase revenue.  

The GDP growth didn't materially change under Trump  even though his worshipers still believe it did.  As you can see, the Pandemic caused it to take a hard hit in the second quarter of 2020, but then came back strong in the third quarter only to go back to normal in the 4th.

To sit here and claim Trump's tax cuts caused this roaring change to the economy is just simply not being honest.

gdp4q20_adv-chart-01.png


When was the economy going to get to this point?

The economy now is at 3%. Nobody thought it would be anywhere close. I think it could go to 4, 5, and maybe even 6%, ultimately.” – President Trump, Dec. 16, 2017 

 
Last edited by a moderator:
The deficit is a byproduct of the insane amount of spending by all parties.  The tax cuts increased government revenue and if not for COVID record revenue would have continued into FY2021/2022
Federal revenue increases YOY almost every single year. Infact, it's been increasing every year by about $100-200B a year since 2010.

 
Last edited by a moderator:
Sure.  Peak 2017 (tax cut passed) to peak 2019 represents a roughly 15-20% gain.

 In 2 years.  Peak 2015 to Peak 2017 represents a loss (2 years prior to tax cut). You didn’t notice that :dunno
Yeah...the shape of the graph really changed didn't it?   :laughpound

By this logic, Obama was amazing in 2013, 2014 and 2015, do you agree with that?

No comments on the other graphs I posted links to?

 
Last edited by a moderator:
Isn't it weird how the trends just continued from years before 2016. Where have I seen that before?  :lol:
Yeah, and it's also funny that he just keyed on the peaks and didn't comment on the fact the rest of the graph actually went down slightly.  

 
I claimed it brought record revenues.  To say otherwise is being dishonest.  


Do you understand what the peaks represent?  Do you understand what the other quarters represent?  
You can’t take this stuff out of context and claim A was the cause of B. That would be like saying Biden was solely responsible for the masses getting vaccinated and bringing the pandemic to an end. We both know he may have made a positive impact in that regard but we also were likely to get there anyway. The economy is never that simple.

Or, while I’m doing analogies, it was raining this morning and I got laid. Therefore it would be dishonest to say I don’t get laid on days it rains. There are a lot more factors involved than cherry picking one coincidental fact.

 
Do you understand what the peaks represent?  Do you understand what the other quarters represent?  
Lol....yeah, but I question if you do.  
 

This is a chart of monthly revenue. I’m assuming the peak is April when most people are paying in. The other peaks would be the quarterly inputs for who pays quarterly. 
 

So, to annualize this you would need to add those togetherWhen you go that, what do you see compared to the rest of the chart?. 


Back
Top